

On September 3, 2025, Finance Minister Nirmala Sitharaman unveiled GST 2.0 — a major overhaul of India’s indirect tax system. The reform replaces the earlier multiple slabs with a simpler two-rate structure of 5% and 18%, while introducing a special 40% bracket for luxury and demerit goods. Effective from September 22, 2025, this change has been hailed as one of the most ambitious attempts to simplify GST since its inception.
For the Indian middle class, the new system promises relief from the confusing slab structure and a lighter tax burden on everyday essentials. Policymakers expect it to stimulate domestic demand, improve affordability, and create jobs, while critics caution about possible revenue implications and uneven benefits.
At FinMonkey, we cut through the jargon to ask a simple question: What does GST 2.0 actually mean for the aam aadmi? In this article, we break down the new system, show how it affects household budgets across income groups, and explain why the promised savings may — or may not — feel visible in your monthly expenses.
| Category / Items | Examples | Old GST | New GST | Notes / Source |
|---|---|---|---|---|
| Essentials becoming tax-free (select) | Milk, paneer, some Indian breads; select life-saving drugs | Varied (0–5% or 12%/18% for some items) | 0% (nil) for specified items | Essentials highlighted as tax-free under GST 2.0. Source: indiatimes roundup; BBC/press coverage. [Ref] |
| Healthcare items cut to 5% | Thermometers; medical oxygen; diagnostic kits/reagents; glucometers & test strips; corrective spectacles | 12%–18% | 5% | NDTV list of healthcare cuts (18→5 or 12→5). [Ref] |
| Footwear & Textiles | Mass-market footwear, apparel & textiles | 12% | 5% | Rate cut 12→5 for footwear/textiles. [Ref] |
| Consumer durables & electronics | Air conditioners, televisions, dishwashers, refrigerators, washing machines; (mobiles/laptops included in several roundups) | 28% | 18% | Broad 28→18 cut on durables (TOI tech). [Ref] |
| Auto sector (illustrative) | Small vehicles, auto parts; several car models saw ex-showroom price cuts post-revamp | Higher previous incidence (incl. 28% on many) | 18% (model-specific outcomes vary) | News reports on price cuts post-GST 2.0 in autos. [Ref] |
| Demerit / luxury goods (new bracket) | Tobacco products; luxury cars; select sin/luxury items | Varied (incl. 28% + cess earlier) | 40% (special demerit rate) | New 40% bracket introduced for sin/luxury goods. [Ref] | [Ref] |
| Implementation date | All goods & services (except specified tobacco items) | — | Effective Sep 22, 2025 | GST Council/PIB press releases confirm effective date; phased nuances for some items. [PIB] | [PDF] |
Note: GST 2.0 collapses most items into two slabs (5% and 18%) while introducing a 40% demerit bracket. The earlier 12% and 28% slabs are removed. Always cross-check item-level notifications for HS codes and final classifications. Sources: NDTV, TOI, Hindustan Times, India Briefing, PIB Press Releases.
Table of Contents
Methodology
Our approach to estimating household savings from the GST rate cuts is systematic and data-driven. Rather than using a one-size-fits-all estimate, we broke the analysis into clear steps that mirror how households actually spend. This allowed us to capture differences across income groups and ensure that the results are both realistic and transparent.
1. Baseline Household Expenditure
We began with official consumption data (HCES 2022–23). For illustration, we looked at three income groups with different spending levels:
- Poor households: around ₹15,000 per month
- Middle-class households: around ₹40,000 per month
- Wealthy households: around ₹1,00,000 per month
2. Splitting the Basket
Household spending is not uniform. It can be grouped broadly as:
- Essentials: food, toiletries, medicines (30–40%)
- Services: insurance premiums, medical expenses, education (8–10%)
- Durables: ACs, TVs, dishwashers, etc. (6–7%)
- Others: clothing, recreation, miscellaneous (the remainder)
3. Identifying Affected Items
Not every item in these categories got cheaper. For example, toothpaste and hair oil moved from 18% GST to 5%, but rice was already at 0% and remained unchanged. We applied an affected share (20–50%) within each category to capture only the items that were impacted.
4. Tax Rate Reductions
The average cuts were grouped as:
- Essentials and services: ~10 percentage points (e.g., 18% → 5%)
- Durables: ~10 percentage points (28% → 18%)
- Other goods: smaller cuts, ~5 percentage points
5. Pass-Through Assumption
We assumed that only 70% of the tax cut reaches consumers as lower retail prices. This is because traders absorb some of the benefit, and there are often delays in changing Maximum Retail Prices (MRPs). This ‘pass-through assumption’ is a common practice in economics, and it helps to estimate the actual savings that households can realistically expect.
6. Frequency of Durables
Families don’t buy big-ticket items like TVs, ACs, refrigerators, or washing machines every month. To avoid overstating the benefit, we spread (monthlyize) the durable-related savings across the year. This yields a realistic monthly estimate instead of a one-time spike.
7. The Formula
Example Calculation: Middle-Class Household (₹40,000/month)
| Category | Share of Budget (wᵢ) | Affected Share (cᵢ) | Avg GST Cut (Δτᵢ) | Pass-Through (pᵢ) | Frequency (fᵢ) | Monthly Saving (₹) |
|---|---|---|---|---|---|---|
| Essentials (food, toiletries, health) | 35% = 14,000 | 25% | 10% | 70% | 1.0 | 245 |
| Services (insurance, medical, education) | 10% = 4,000 | 50% | 10% | 70% | 1.0 | 140 |
| Durables (TV, AC, dishwasher) | 7% = 2,800 | 50% | 10% | 70% | 0.1 | 10 |
| Other affected goods (dairy, stationery, baby items) | 8% = 3,200 | 20% | 5% | 70% | 1.0 | 45 |
| Total | ₹440 | |||||
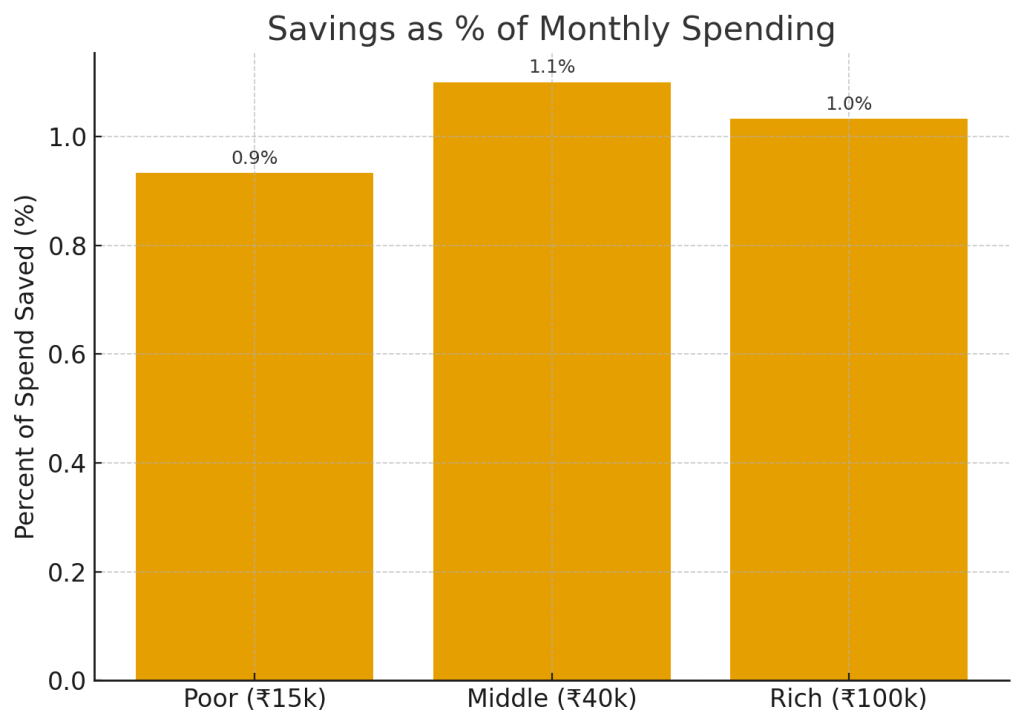
Takeaway: Despite significant GST re-slab, the monthly saving for a typical middle-class basket remains modest (~1.1%).
Example Calculation: Poor Household (₹15,000/month)
| Category | Share of Budget (wᵢ) | Affected Share (cᵢ) | Avg GST Cut (Δτᵢ) | Pass-Through (pᵢ) | Frequency (fᵢ) | Monthly Saving (₹) |
|---|---|---|---|---|---|---|
| Essentials (food, toiletries, health) | 50% = 7,500 | 15% | 10% | 70% | 1.0 | 79 |
| Services (insurance, medical, education) | 5% = 750 | 30% | 10% | 70% | 1.0 | 16 |
| Durables (TV, AC, etc.) | 2% = 300 | 20% | 10% | 70% | 0.1 | 0.4 |
| Other affected goods (stationery, baby items, etc.) | 3% = 450 | 20% | 5% | 70% | 1.0 | 3 |
| Total | ₹140 | |||||
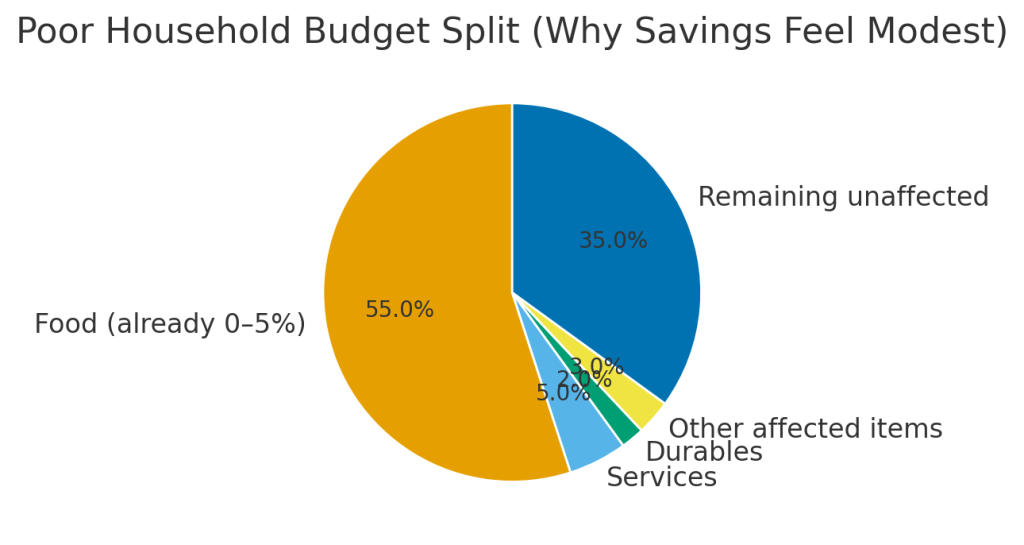
Takeaway: For poor households, most spend is on staples already at 0–5% GST, so the reform barely moves the monthly bill (~0.9% relief).
Example Calculation: Wealthy Household (₹1,00,000/month)
| Category | Share of Budget (wᵢ) | Affected Share (cᵢ) | Avg GST Cut (Δτᵢ) | Pass-Through (pᵢ) | Frequency (fᵢ) | Monthly Saving (₹) |
|---|---|---|---|---|---|---|
| Essentials (food, toiletries, health) | 25% = 25,000 | 25% | 10% | 70% | 1.0 | 438 |
| Services (insurance, medical, education) | 15% = 15,000 | 50% | 10% | 70% | 1.0 | 525 |
| Durables (TVs, ACs, appliances, etc.) | 10% = 10,000 | 50% | 10% | 70% | 0.1 | 35 |
| Other affected goods (stationery, baby items, etc.) | 5% = 5,000 | 20% | 5% | 70% | 1.0 | 35 |
| Total | ₹1,033 | |||||
Takeaway: Wealthier households see bigger absolute savings, but relief as a share of spend remains modest (~1%).
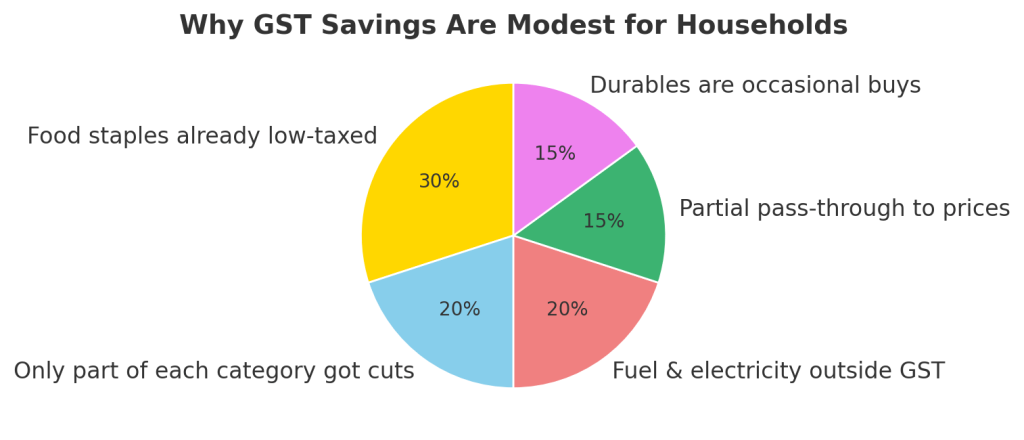
Bottom line: Even with substantial structural changes to GST, household-level savings remain small in monthly terms, largely because many staples were already taxed at 0–5%, only slices of categories got rate cuts, pass-through is partial, and durable purchases are infrequent.
📌 Note:
Although all income groups save roughly 1% of their monthly budget, the relief feels invisible. For poorer households, over half of spending is on food (already taxed at 0–5%) and fuel/electricity (outside GST). This means the scope for new savings is very limited, even if headline GST rates were cut.
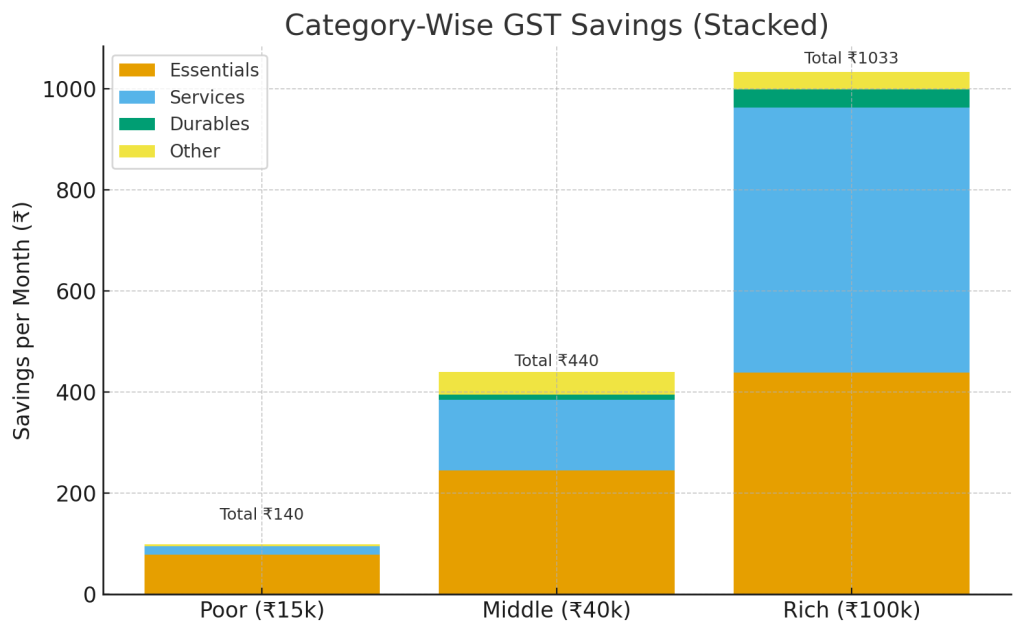
Footnote: Savings vary by category. Poor households gain mostly from essentials, middle-class households from both essentials and services, while rich households see the largest relief in services. Durables contribute little to monthly savings since they are purchased infrequently.
8. Putting It Together
We applied this formula across all categories (essentials, services, durables, others) and added the results to arrive at total household savings. This approach, which avoids overestimation, is fair and transparent, giving a clear and unbiased view of the potential savings.
👉 The result: while the savings are real, they are modest — typically amounting to around 1% of monthly household expenditure. This translates to ₹140 for poor households, ₹440 for middle-class, and ₹1,100 for wealthier households in baseline months, managing expectations and avoiding overestimation.
Why this happens?
Even though things feel cheaper to ignite a consumption boom on paper , It is not the case it is due to few reasons Even though GST rates were reduced, most families barely notice the difference because:.Lets explore each of them
Food staples were already low-taxed and low impact on family budget
Most poor families spend 40–60% of their budget on food staples. Most of these items (rice, wheat, fresh vegetables, milk) were already taxed at 0–5%. Since they didn’t get further cuts, half the budget stays unchanged.So it would not make a big change in the whole family budget.Giving no real benefit to the common man. We cannot also rule out the possibility of these savings being eroded if food inflation creeps In.So in effect on family budget.Similarly GST was reduced for items like toothpaste but it wont make a noticeable change in family budget.
Exclusion of Major Household Expenses from GST
Crucially, some of the largest and most volatile household expenses are not covered by the GST system. These include:
- Fuel: Petrol and diesel are taxed under central excise duty and state VAT.
- Cooking Gas: LPG and kerosene are also outside the GST regime.
- Electricity: Bills for electricity are not part of the GST framework. Since these categories represent a significant and unavoidable cost for most families, the GST reforms offer no relief in these areas.
Incomplete Pass-Through to Consumers
It is assumed that retailers and producers absorb a portion of the tax cut, rather than passing 100% of the benefit to the consumer. Factors like existing inventory, the cost of re-stickering MRPs, and margin management mean that a 70% pass-through rate is a more realistic projection, which inherently reduces the final savings figure.
Infrequent Purchase of Durable Goods
While durable goods saw one of the largest slab reductions (28% to 18%), households do not purchase these high-value items on a monthly basis. By “monthlyizing” or averaging the potential savings over a longer period, the immediate impact on a typical month’s budget appears very small.
What Could Have Been Done to Make Savings Felt (for real)
- Petrol, diesel, LPG, and electricity are outside GST and remain heavily taxed. Including them even at a higher GST slab would cut costs in the most visible part of family budgets.But sadly wont happen due to backlash from petroleum companies and states as this means a loss of revenue to them.
- Relief on soap, detergent, cooking oil, packaged foods would be felt every week in grocery bills.Currently, many of these remain at 12–18% rates.Only targeted inteventions can bring noticeable changes in the family budget.Otherwise its like a line on the water.
Insurance, school fees add-ons, internet/data packs.Data packsare a part and parcel pf the common and the era of common man. lowering GST here would benefit both middle-class and poor households more directly.
Ensure businesses actually reduce MRPs after cuts (through compliance checks).Without this, savings remain on paper while prices stay the same.
Public transport fares, affordable housing materials, and utility services still carry significant GST.Cuts here would touch nearly every household.
Conclusion
Although the GST reduction appears significant on paper, our observations suggest that these reforms have not effectively boosted the savings of the common man, despite the existence of savings. It is essential to have a structural revamp in GST to enhance purchasing power and thereby boost real savings in the economy. The government must bravely take such reforms; only then will the benefits of the policy reach the common man.
References
- Household Consumption Expenditure Survey (HCES) 2022–23 – Ministry of Statistics and Programme Implementation (MOSPI). Fact Sheet PDF
- Data for India – “Consumption Expenditure in India” (2023). Link
- Average Indian Monthly Household Spend – Hindustan Times, “Average Indian’s monthly spend rises, shows survey” (2024).
- CNBC – “India modifies tax rates in bid to spur consumption, blunt tariff impact” (Sept 2025).
- BBC News – “GST Council rate cuts: What gets cheaper, what doesn’t” (Sept 2025).
- The Economic Times – Coverage of GST Council meeting and tax slab revisions (Sept 2025).
- The India Forum – “Household Consumption Expenditure Survey 2022–23: What we learn” (2024).
- Statista – Household spending growth and category shares in India (2023–24).
- Tradeimex – “GST 2.0: India tax reform slabs reduction” (2025).

Rather than true relief to the poor and lower middle class -GST -cuts seem to be another cocktail story with no serious concern for those who matter the most. Nothing great can be achieved by low-cunning, said Swami Vivekananda. Politicians remain politicians after all. If we take them very seriously we shall never be able to realize the true worth of life.
We have to educate our youths so that they can build their life and character on the firm plinth of Honesty, Integrity. Sympathetic to the poor and downtrodden.
“Then will; India arise when hundreds of large hearted men and women giving up all desires of enjoying the luxuries of will long and desire to their utmost for millions and millions of their countrymen who are gradually sinking lower and lower in the vortex of poverty and destitution.” -Swami Vivekananda.
For politicians power is the ultimate goal and for that they can go down to any length in deceiving people. Left or right, Ram or Baam there is no exception.